

Today, knowledge graphs are becoming indispensable for businesses seeking to improve content management, user engagement, and operational efficiency. By adopting them, organizations can turn static documentation into dynamic, user-focused knowledge bases.
Imagine a system that not only links related topics seamlessly but also anticipates what the user needs—offering tailored content and context-aware search results. The result? Less frustration, faster issue resolution and users finding exactly what they need, when they need it.
For example, Microsoft Learn has introduced a domain-specific knowledge graph connecting concepts, tutorials, APIs and troubleshooting guides across Azure and Microsoft 365. This structure supports semantic search and content suggestions aligned with a learner’s journey.
In this article you’ll learn the basics of knowledge graphs, why they’re vital for modern documentation strategies, and the key technical components that underpin them. We’ll also cover obstacles and best practices to help you successfully implement a knowledge-graph-driven documentation system—and turn your content into a strategic asset.
Overview of Knowledge Graphs
A knowledge graph is a data model that structures information as entities and the relationships between them. This semantic framework captures the contextual meaning behind data points, enabling machines to interpret content more similarly to how humans do. For businesses, this means moving beyond traditional keyword-based systems toward knowledge-driven platforms that connect concepts, products, processes, and customer queries into one interconnected web.
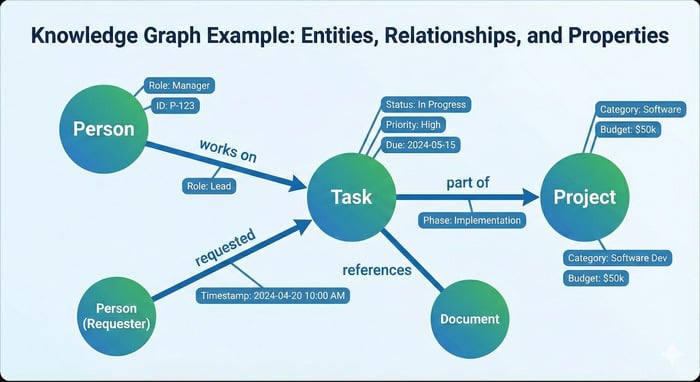
This approach is often illustrated through a graph diagram, where:
- Circles (nodes) represent entities such as “Person,” “Task,” or “Project.”
- Lines (edges) represent relationships such as “works on,” “part of,” or “requested.”
- Additional labels or properties on nodes and edges capture extra context, including status, category, timestamps, or semantic roles.
Such diagrams make it immediately clear, for example, whether all required skills for a project exist within an organization or whether gaps remain. This helps not only with documentation retrieval but also with resource planning and operational decision-making.
Why It Matters for Businesses
Accurate and accessible documentation is critical for customer support, onboarding, compliance, and product adoption. Knowledge graphs matter because they provide powerful, measurable benefits:
- Improve content discoverability. Knowledge graphs relate previously disconnected information pieces. Imagine a visual network where nodes like “User Guide,” “API Documentation,” and “Tutorial” are linked by edges such as “references,” “explains,” or “expands on.” This network allows users to trace related content intuitively. In e-commerce, for instance, graphs can connect products with user preferences and purchase history, enabling relevant recommendations and helping users find the right content quickly. According to McKinsey, knowledge workers spend up to 20% of their time searching for information, and knowledge graphs can reduce this inefficiency by integrating scattered data sources into a unified, discoverable structure.
- Reduce time-to-resolution. A support-focused knowledge graph can automatically link common error messages to troubleshooting steps and escalation contacts. When a user reports a problem, the system can immediately present a web of possible fixes and resources. Some organizations report up to 25–40% faster issue resolution after integrating knowledge graphs with their support systems.
- Enable personalization. The graph can tailor information flows to different user roles or preferences. For example, nodes relevant to “New Employees,” “Admins,” or “Compliance Managers” can be highlighted or tagged. In interactive visualizations, users might select their role and see the relevant paths light up. Recommendation engines powered by the graph deliver curated content and procedures for each user type. Case studies show that onboarding engagement increased by as much as 50% when content was personalized through a knowledge graph.
- Support scalable documentation. As your products or regulations evolve, you can simply add new nodes and connections to the graph without redesigning your documentation architecture. Knowledge graphs can scale efficiently—from thousands to hundreds of thousands of entities—without major performance or structural redesign, making growth manageable.
- Enhance analytics and insight. Usage data and graph analytics can highlight core clusters and isolated nodes, revealing which documentation is most used and which topics are neglected. This helps teams identify outdated or underlinked content. In practice, some documentation teams report cutting roughly 35% of outdated or redundant content after analyzing graph usage and prioritizing improvements.
These benefits show how a knowledge graph transforms your documentation from a static file repository into a living, interconnected knowledge ecosystem. The result is lower costs, higher user satisfaction, and a foundation for continuous digital transformation.
The Technical Structure of a Knowledge Graph
Business-grade knowledge graphs follow a formal and extensible architecture composed of several core components:
- Nodes (Entities): These represent business objects such as products, features, regulations, or customer roles. A corporate graph may contain tens of thousands of nodes representing employees, departments, and business units. A well-known example is LinkedIn’s public knowledge graph, which connects hundreds of millions of entities: over 450 million member nodes, 9 million company nodes, 190 million job listings, and tens of thousands of skills, schools, and titles. Each node encodes a business or professional entity such as a user, job, skill, or organization.
- Edges (Relations): Edges define meaningful connections such as “requires,” “is version of,” or “addresses issue.” Large enterprise graphs typically contain millions of edges linking documents, people, transactions, and system components, enabling rich queries, reasoning, and inference across the organization.
- Attributes(Properties): Attributes serve as metadata attached to nodes and edges — including timestamps, confidence scores, and data sources. These properties are essential for auditability, trust scoring, and version tracking. Platforms like Amazon Neptune and Neo4j support property-graph models in which both nodes and edges can hold many key–value properties, allowing real-time updates and historical change tracking.
- Ontologies (Schemas): Ontologies provide the controlled vocabularies and structural rules that govern how entities and relationships should be modeled. They enforce consistency across domains and ensure alignment with regulatory or compliance requirements. In tightly regulated fields like healthcare or finance, ontologies may contain hundreds of entity types, relationship types, constraints, and formal logic rules.
All of these components operate within scalable, distributed graph databases, such as Neo4j — which supports production deployments exceeding one billion nodes — and Amazon Neptune, which powers high-throughput enterprise applications. These systems integrate with broader enterprise data platforms via APIs to support analytics, reporting, automation, and workflow orchestration.
Building a Knowledge Graph for Documentation
Constructing a business-focused knowledge graph follows a systematic process grounded in real operational practice. Here’s how each step is implemented:
- Domain Analysis: Engage stakeholders to define the critical entities and relationships. For example, LinkedIn’s graph covers over 1 billion members, 65 million active company pages and 22 million job posts (2025 estimate), requiring extensive upfront work to define which entity types (members, jobs, skills, companies) and relationships (WORKS_AT, HAS_SKILL, APPLIED_FOR) are most relevant to the business.
- Data Aggregation: Integrate internal documents, support tickets, CRM data and product specifications. Enterprises often ingest tens of millions of internal records — customer support tickets, CRM objects and product documentations. For example, large SaaS companies map thousands of support interactions and document updates per day into their knowledge graph for unified access and analysis.
- NLP and Semantic Tagging: Apply AI tools to automatically extract entities and contextual relationships from unstructured text. At LinkedIn’s scale, natural-language processing handles text from user profiles, job descriptions and posts to keep the graph current.
- Ontology Development: Develop domain-specific ontologies to ensure semantic consistency across business units. Precise vocabularies and data models are created so that, for instance, standardized job titles, skills and roles allow consistency across the graph and align with global reporting standards.
- Iterative Refinement: Implement continuous quality checks and user feedback loops to maintain relevance and accuracy. Regular feedback (for example from LinkedIn’s large user base) feeds into algorithm adjustments and improves data quality.
- System Integration: Connect the graph with content management systems (CMS), chatbots and search platforms. The resulting knowledge graph is integrated into production systems delivering instant search results, recommendations and tailored content feeds.
By following this structured approach, a modern knowledge graph transforms siloed enterprise data into a living, connected and intelligent resource — enabling scalable automation, enhanced discovery and actionable insights.
Table: Steps for Building a Business-Focused Knowledge Graph
| Step | Key Actions | Common Pitfalls | KPIs / Success Metrics |
| 1. Domain Analysis | – Interview stakeholders– Identify critical entities and relationships– Highlight business-critical areas | – Vague entity definitions– Duplicate object types– Missing key business roles | – Domain coverage (%)– Number of approved entities– Time to consensus on the model |
| 2. Data Aggregation | – Integrate CMS, CRM, support tickets, documentation– Clean and normalize data– Deduplicate records | – Unprocessed duplicates– Incomplete or inconsistent data– Lack of single source of truth (SSOT) | – % of integrated data sources– % of clean records after ETL– Number of API integrations |
| 3. NLP & Semantic Tagging | – Automatically extract entities– Classify and tag text– Enrich content contextually | – Low NER/RE accuracy– Incorrect entity linking (“skill drift”)– No human-in-the-loop validation | – NER/RE accuracy (F1-score)– % of documents automatically enriched– Reduction in manual tagging effort (hours/week) |
| 4. Ontology Development | – Design the graph schema– Define rules, constraints, and vocabularies– Establish business constants | – Overly complex or bloated ontology– No version control– Inconsistent naming conventions | – Number of approved terms– Number of model conflicts (consistency errors)– Speed of onboarding new entities |
| 5. Iterative Refinement | – Conduct regular data quality checks– Collect user feedback– Update and refine the model | – No iterative improvement cycles– Errors in data not tracked– Ignoring behavioral signals | – Reduction in dead-end queries (%)– Increase in CTR of recommended content– Number of errors corrected per iteration |
| 6. System Integration | – Connect the graph to search, chatbots, CMS– Configure APIs– Enable real-time updates | – Poor performance or no caching– Weak integration with search– Lack of monitoring | – Query response time (ms)– % of requests served via KG– Improved search precision/recall |
| 7. Governance & Scaling (recommended additional step) | – Manage access and permissions– Maintain ontology version control– Monitor growth and performance | – No ownership model– Opaque update processes– Graph performance degradation at scale | – Growth rate of nodes/edges– Response time under load– Number of data quality incidents |
Applications in AI and Machine Learning for Businesses
Knowledge graphs enhance AI capabilities, enabling businesses to maximize the impact of their documentation:
- Contextual Search Engines: Deliver precise results that understand user intent, synonyms, and related concepts. By 2025, it is projected that 80% of data and analytics innovations will incorporate graph technologies, up from just 10% a few years ago, enabling more accurate and context-aware search results.
- Virtual Assistants: Provide automated, context-aware support powered by the underlying graph. Major cloud platforms are increasingly integrating scalable graph services into AI assistants, enhancing automation and support efficiency.
- Predictive Analytics: Identify gaps or emerging issues by analyzing usage and feedback patterns. Organizations using knowledge graphs for predictive insights report improved risk management and operational decision-making.
- Automated Content Generation:Support the creation of machine-generated summaries, FAQs, and guided workflows tailored to individual user profiles. AI tools, including NLP and machine learning, automate extraction and interpretation of relationships in data, reducing manual effort while improving content quality.
- Compliance Monitoring: Ensure documentation aligns with regulatory standards using graph-based validation rules. Businesses leverage these systems to streamline compliance, auditing, and reporting processes.
By embedding knowledge graphs into AI workflows, organizations can reduce reliance on manual content updates, improve efficiency, and accelerate service excellence.
Challenges and Best Practices for Business Implementation
Despite their benefits, adopting knowledge graphs presents several challenges, including data silos, ontology complexity, and organizational change management. To increase the likelihood of success, businesses should follow these best practices:
- Start small: Focus on targeted use cases, such as customer FAQs or product manuals, before scaling across the organization.
- Collaborate cross-functionally: Involve IT, content teams, and business experts to ensure both technical feasibility and business relevance.
- Leverage established tools: Use proven graph databases and AI tools to reduce technical debt and accelerate implementation.
- Automate entity extraction and relationship mapping: Apply supervised machine learning to efficiently process large volumes of unstructured content.
- Implement governance policies: Define clear rules for data quality, privacy, and version control to maintain a trustworthy knowledge graph.
- Continuously monitor performance: Track graph metrics and user behavior to refine the system and address gaps or inefficiencies.
A disciplined, iterative approach helps maximize ROI, ensuring that knowledge graphs become a core pillar of the organization’s digital knowledge infrastructure.
Conclusion
Enterprise knowledge graphs are transforming the way organizations manage, access, and leverage information. By unifying fragmented data into a single, semantically rich view, they enable deeper insights, faster decision-making, and greater operational efficiency. Knowledge graphs also support advanced AI applications, improve compliance, and foster organizational agility, allowing businesses to respond quickly to evolving market demands.
The cumulative effect is a more intelligent, responsive, and competitive enterprise—one that moves beyond merely collecting data to truly understanding and leveraging knowledge for strategic advantage.
Good luck with your technical writing!
Author, host and deliver documentation across platforms and devices
FAQ
What is a knowledge graph?
A knowledge graph is a data model that represents information as interconnected entities (nodes) and relationships (edges). It captures the semantic meaning behind data, allowing machines—and humans—to understand context, connections, and dependencies across an organization’s knowledge base.
How is a knowledge graph different from traditional search?
Traditional search relies on keywords and simple text matching. Knowledge graphs go beyond that by understanding relationships between entities, enabling context-aware search, personalized recommendations, and intelligent insights that traditional search cannot provide.
What are the main benefits of implementing a knowledge graph?
– Improved content discoverability and navigation
– Faster issue resolution and decision-making
– Enhanced personalization for users or employees
– Scalable documentation and knowledge management
– Better analytics, insights, and gap identification
– Support for AI applications such as predictive analytics and virtual assistants
Are knowledge graphs suitable for large enterprises?
Absolutely. Enterprise-scale knowledge graphs can handle hundreds of millions—or even billions—of entities and relationships, integrating with distributed systems and scaling with organizational growth.
How do knowledge graphs improve ROI?
By enabling faster information retrieval, reducing manual effort, enhancing user experience, and supporting AI-driven automation, knowledge graphs reduce operational costs and accelerate strategic decision-making, delivering measurable business value.